With so much information available and generated every second – gathering data isn’t enough.
It’s important to measure the things that really impact your success.
It’s about finding the important signals in the noise – understanding what customers think, how they see your brand, and how your efforts translate into business achievements.
This is where B2B brand tracking comes in.
💡 Read Media Monitoring: The Ultimate Guide
B2B brand tracking means exploring the key things to measure, turning data into smart decisions, and using these insights for lasting success in the B2B world.
In this blog, we’ll go through the main metrics you should pay attention to and the easiest ways to do it.
How To Set Up a B2B Brand Tracking System
Choosing the right tools and technology is like selecting the right gear for a challenging expedition. In the realm of B2B brand tracking, it’s about leveraging tools that align with your specific goals. From advanced analytics platforms to social listening tools, the market offers a vast array of options. The goal is to empower you with tools that not only measure but also illuminate the path forward. And this is the reason why 59% of PR professionals choose to use media monitoring tools and social listening platforms like Determ – the information you can get is invaluable.
Implementing a systematic media monitoring tool is the key to turning data chaos into clarity. This involves defining what to track, setting up regular monitoring schedules, and establishing clear benchmarks for success. A well-orchestrated tracking process ensures that you not only collect data consistently but also organize it in a way that facilitates meaningful analysis.
Read How to Efficiently Track Mentions Online
What to track
One of the most important steps when setting up a B2B brand tracking system is to decide what to track. When it comes to your brand, you should definitely consider tracking:
- Your brand mentions
- Your products or services
- Competitor mentions
- Your campaigns
- Key people from the company
- Customer reviews
Customizing your media monitoring tool to track these elements will provide a comprehensive view of your brand’s landscape, allowing you to make informed decisions and respond strategically to various situations.
Key Metrics in B2B Brand Tracking
Brand mentions
Keeping a close eye on brand mentions is fundamental to understanding your brand’s visibility and impact. This metric involves tracking instances where your brand is mentioned across different channels, including social media, news articles, blogs, and forums.
For instance, you might discover that a recent marketing campaign has led to a surge in mentions on social media, indicating a successful brand outreach. Or quite the opposite – it may signify that your brand is mentioned in a really bad context by many, which can point to a crisis brewing.
Mentions in Determ
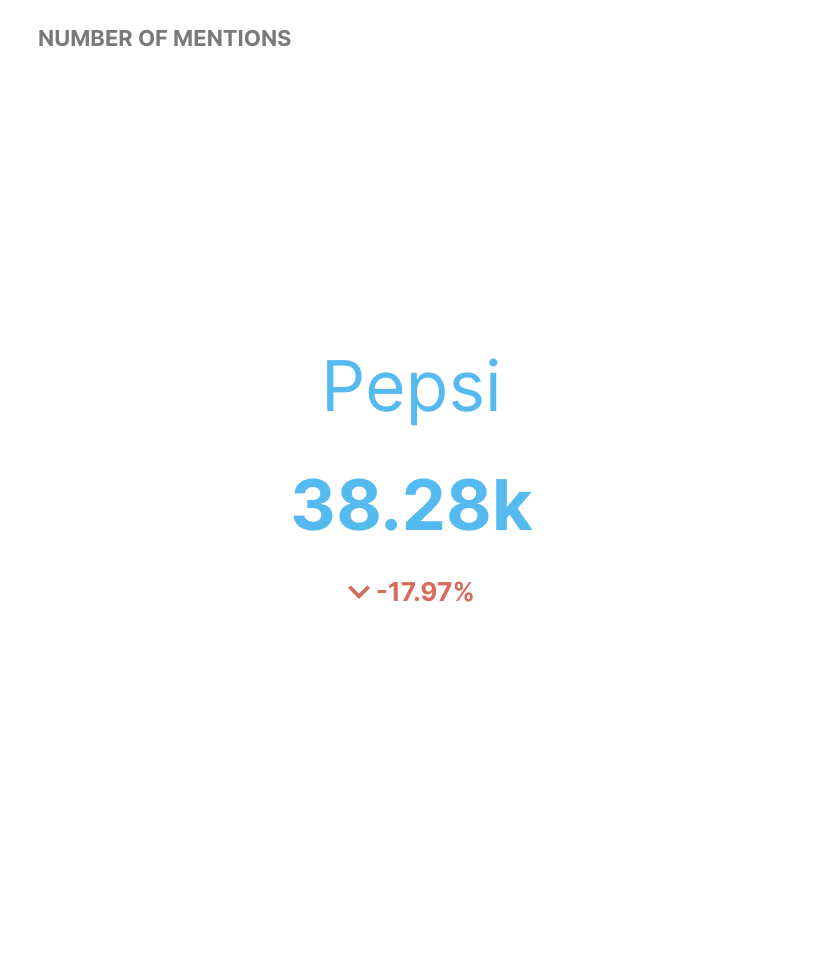
In Determ, there are several charts available within the reports that show the number of mentions. There is one stating the overall number of mentions and it compares it immediately to the number within the previous month so you can see right away if the number has grown or dropped:
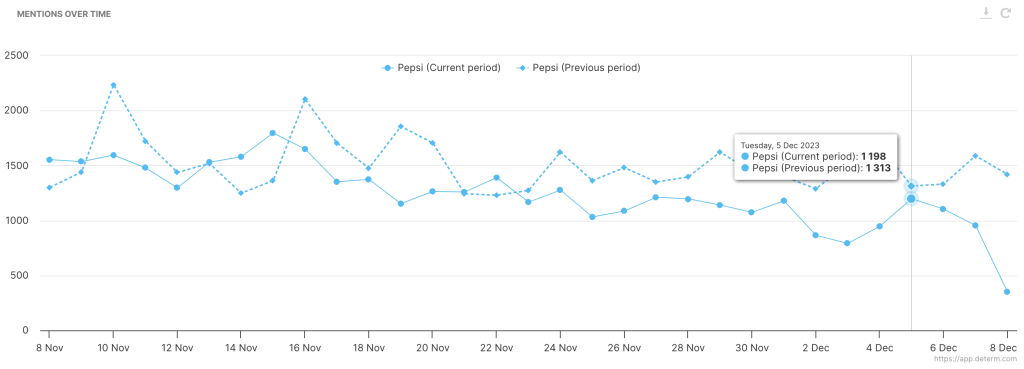
There is a chart showing the number of mentions over time, which enables you to see at which points in time did the number grow or drop. This can help you discover why it happened since a click on the chart opens mentions collected on that day.
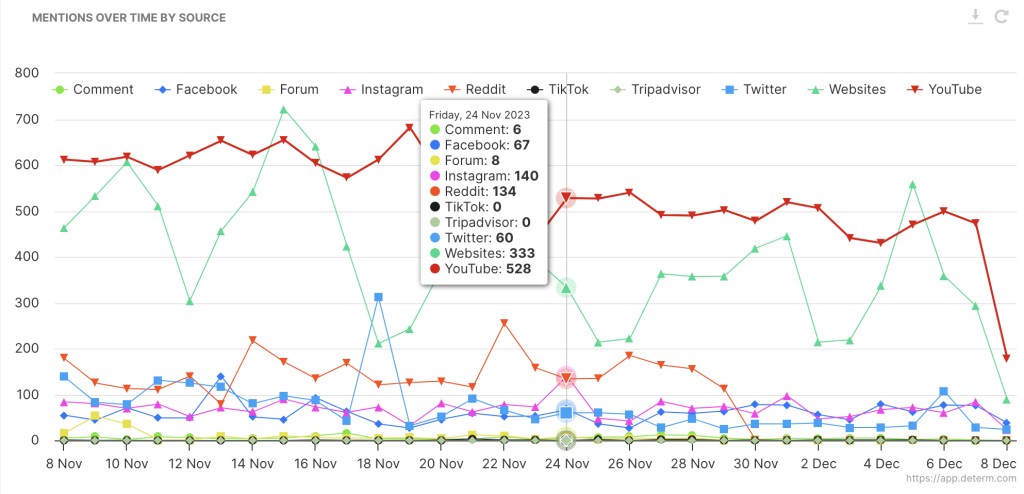
And there is a chart showing mentions over time by source. This is extremely useful when you’re trying to find out which channels are more or less beneficial for your brand visibility and why.
Each of the charts brings additional value since it’s AI-powered by Determ’s PR assistant Synthia. What does that mean?
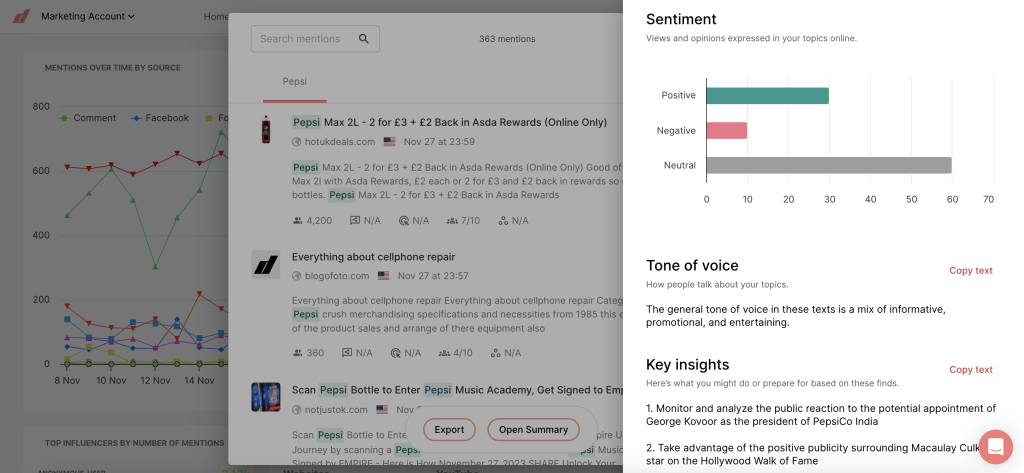
When you click on any of the points in the chart, you get a list of mentions on that day. A click on the button Summarize is a signal to Synthia to give you a summary of all the mentions of that particular day, pointing out the specific tone of voice and sentiment as well as providing a list of tips for you to consider while tracking specific keywords.
Engagement/Reach
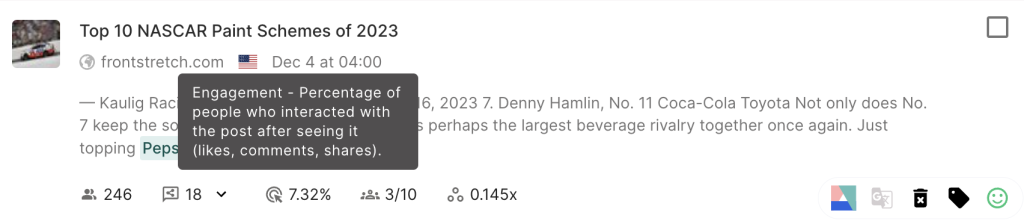
Engagement and reach metrics provide insights into how your audience interacts with your brand. This includes tracking likes, shares, comments, and overall reach on social media platforms. For example, an increase in engagement rates on a LinkedIn post might signify that your content is resonating well with your professional audience, potentially leading to increased brand awareness.
The engagement rate is available within Determ reports as well under each mention. And it’s one of the metrics you can use as a basis for filtering – for example, you may want to filter out your feed to show only mentions with higher engagement rates. This can provide insights into the type of content that resonates with your audience the most.
Read The Power of Personalization: Role of AI in Consumer Engagement
Sentiment
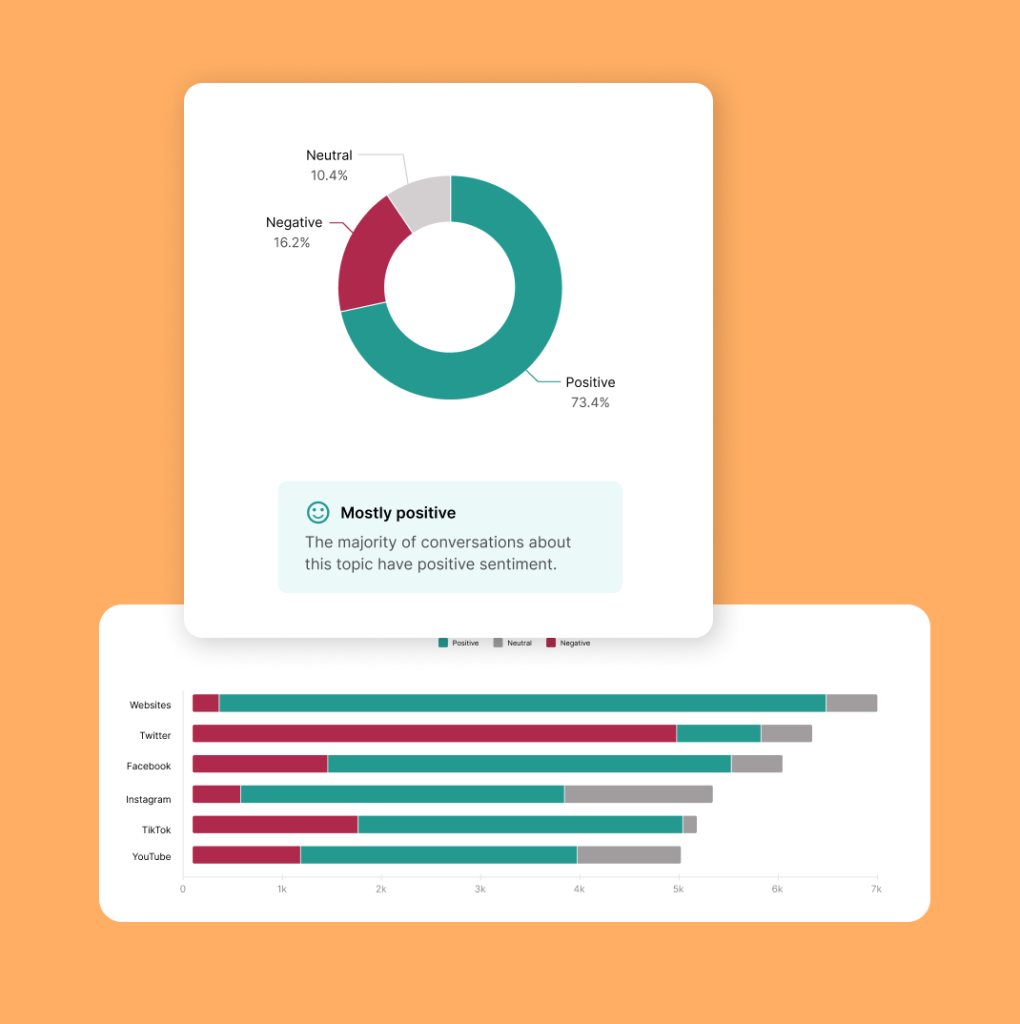
Understanding the sentiment associated with your brand mentions is crucial for inspecting public perception. Sentiment analysis tools classify mentions as positive, negative, or neutral. For instance, monitoring social media discussions might reveal a positive sentiment around your recent product launch, indicating a good response from your audience.
Determ provides several charts for sentiment analysis. It shows the overall ratio of positive, negative and neutral mentions, enabling you to get the overall impression of your brand image. Next to that, you can check the sentiment on specific channels, which is great if you’d like to see where do people express their positive or negative thoughts the most (and maybe direct specific attention to it).
In addition, you can see the sentiment over time chart – this enables you to pinpoint which specific events caused the surge in positive/negative mentions. And learn something from that, of course.
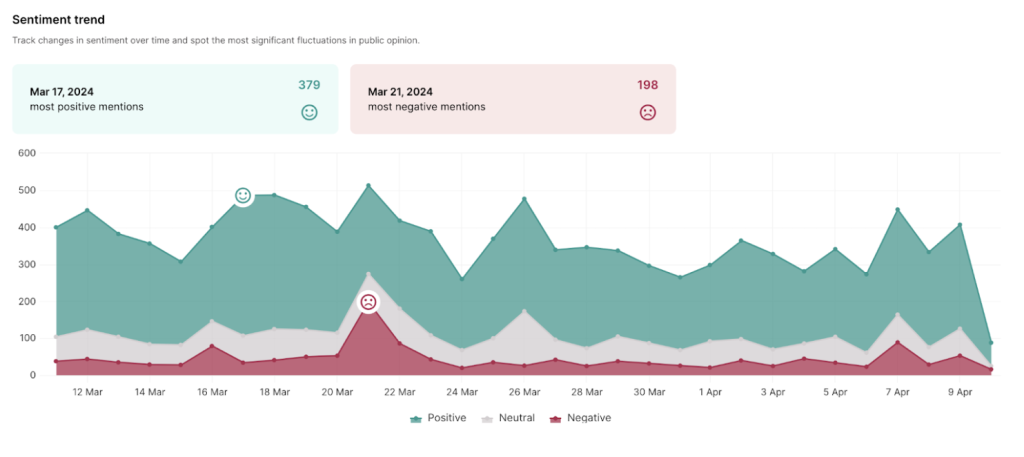
All of these charts are well equipped with Synthia as well, which summarizes the mentions and provides key insights to help you understand the charts better.
Share of voice
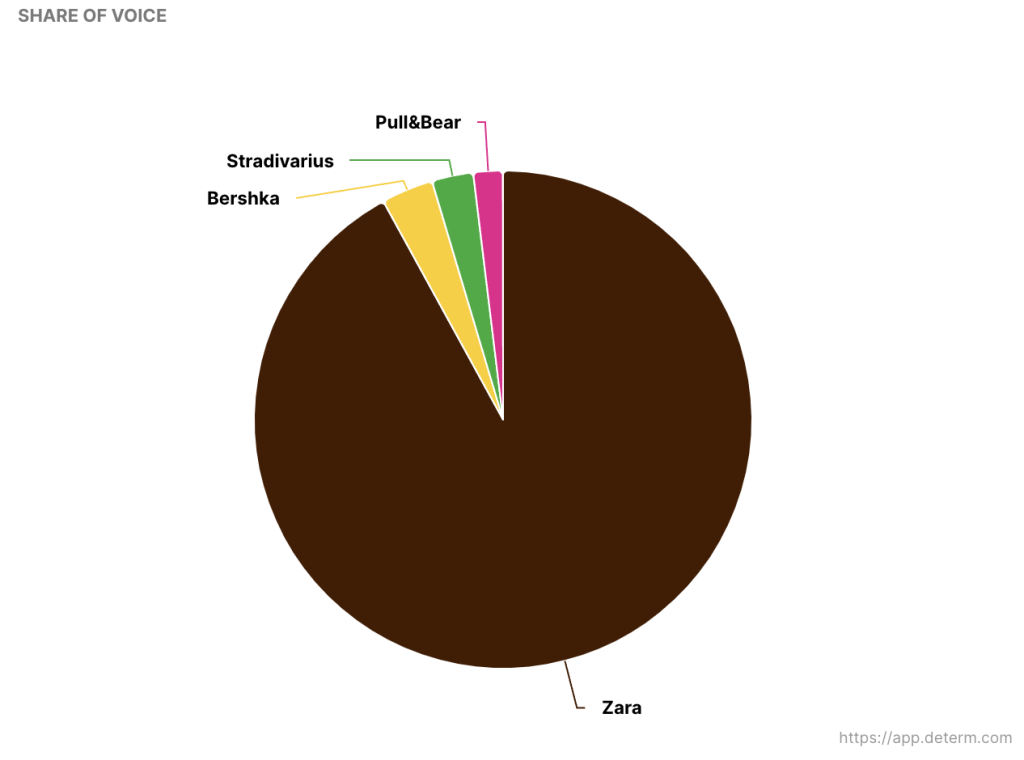
Share of voice measures your brand’s presence compared to competitors in a given market. It involves quantifying the percentage of brand mentions that your business owns within the overall conversation.
For example, if your brand consistently appears in 30% of industry-related discussions, you have a 30% share of voice. This metric helps you assess your brand’s standing relative to competitors and can guide strategies to increase your market presence.
Share of voice graph is available within Determ’s Competitive analysis report. And it is, like all other graphs, powered by Synthia.
Conclusion
As you dive into B2B brand tracking, these key metrics serve as the foundation for understanding how your brand is perceived, where it stands in the market, and how effectively it engages with your target audience. Analyzing these metrics collectively provides a holistic view that informs strategic decisions and helps you stay agile in the constantly evolving landscape of B2B.
If you’d like to try out Determ, and see how to use it to track your brand, book a demo with one of our experts and we’d be happy to show you.

