To truly understand what drives online conversations about a specific topic and what affects their tone and context, it is essential to drill down into sentiment, location, source, and demographics, whenever possible.
The newest addition to the information Determ provides is demographics about gender so that you can draw even more segmented and concrete insights.
Demographics is a new report template available in Determ’s Report section and contains a few new charts, including an emoji cloud.

How Determ detects gender data
In Determ, gender analysis is based on the first names of users in your audience.
Currently available gender detection algorithms can discover only the biological sex, male or female, and assign it as the gender. The two are not always interchangeable, so remember that demographic data is an estimate.
So for any topic you monitor, gender data will be calculated from users whose gender can be detected.
If, for any reason, the algorithm cannot detect gender from a user’s name, e.g., they have a gender-neutral name or are a company profile, Determ will not include those users in the sample to ensure as much data accuracy as possible.
We will continue to enrich our extensive database of first names used for gender detection to improve gender analysis in Demographics further.
Where to find demographics in Determ
Demographics are available to customers on Plus and Premium Determ plans and during the free trial after you go through a demo call.
To view Demographics, go to the Reports tab and click on this new report template.
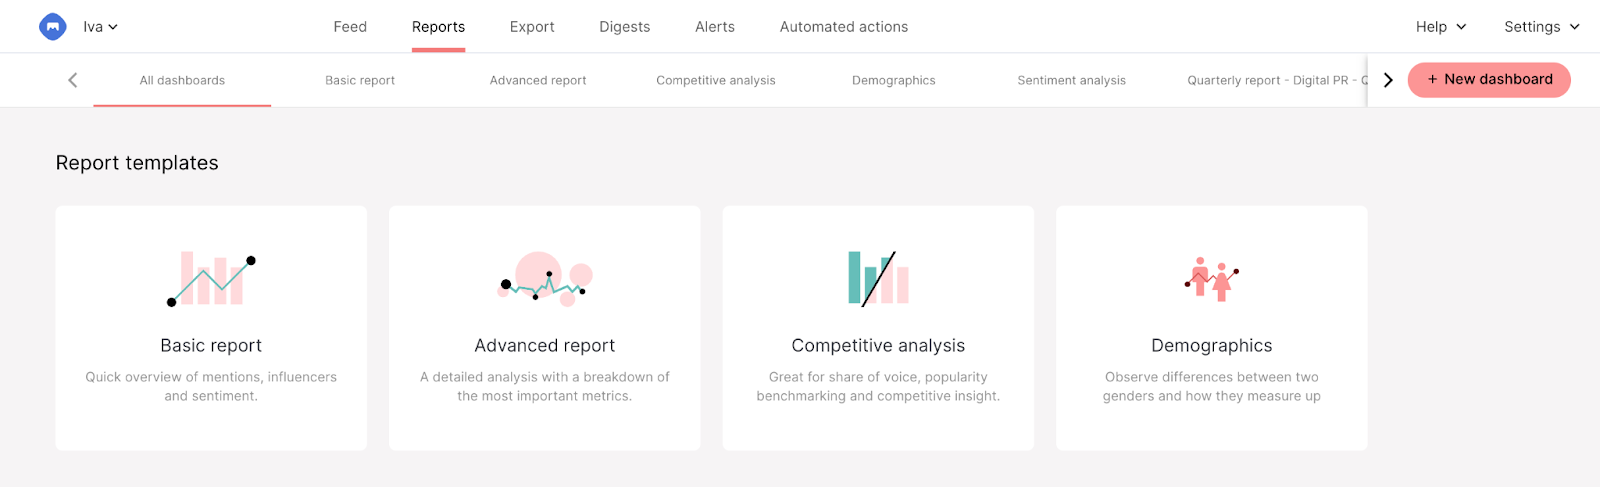
The Demographics report template contains charts specific to this report, designed to display data per gender. Some are present in other report templates but not in this form, while the emoji cloud is a brand-new chart exclusive to the Demographics report template.

We’re working on making the Demographics charts interactive as in other report templates, so you can inspect every chart and see exact mentions that make up specific data or metrics.
How do demographics help with decision-making?
Our mission here at Determ is to help people around the world find and understand relevant information from the media to drive better business decisions. Demographics play a huge role in this process.
Demographic data can be crucial in understanding an audience and what drives their choices, decisions, or opinions. It also helps forecast future trends and how customers react to them based on their demographics, specifically gender.
To demonstrate how demographic data provides another layer of understanding to your results, let’s take Starbucks as an example.
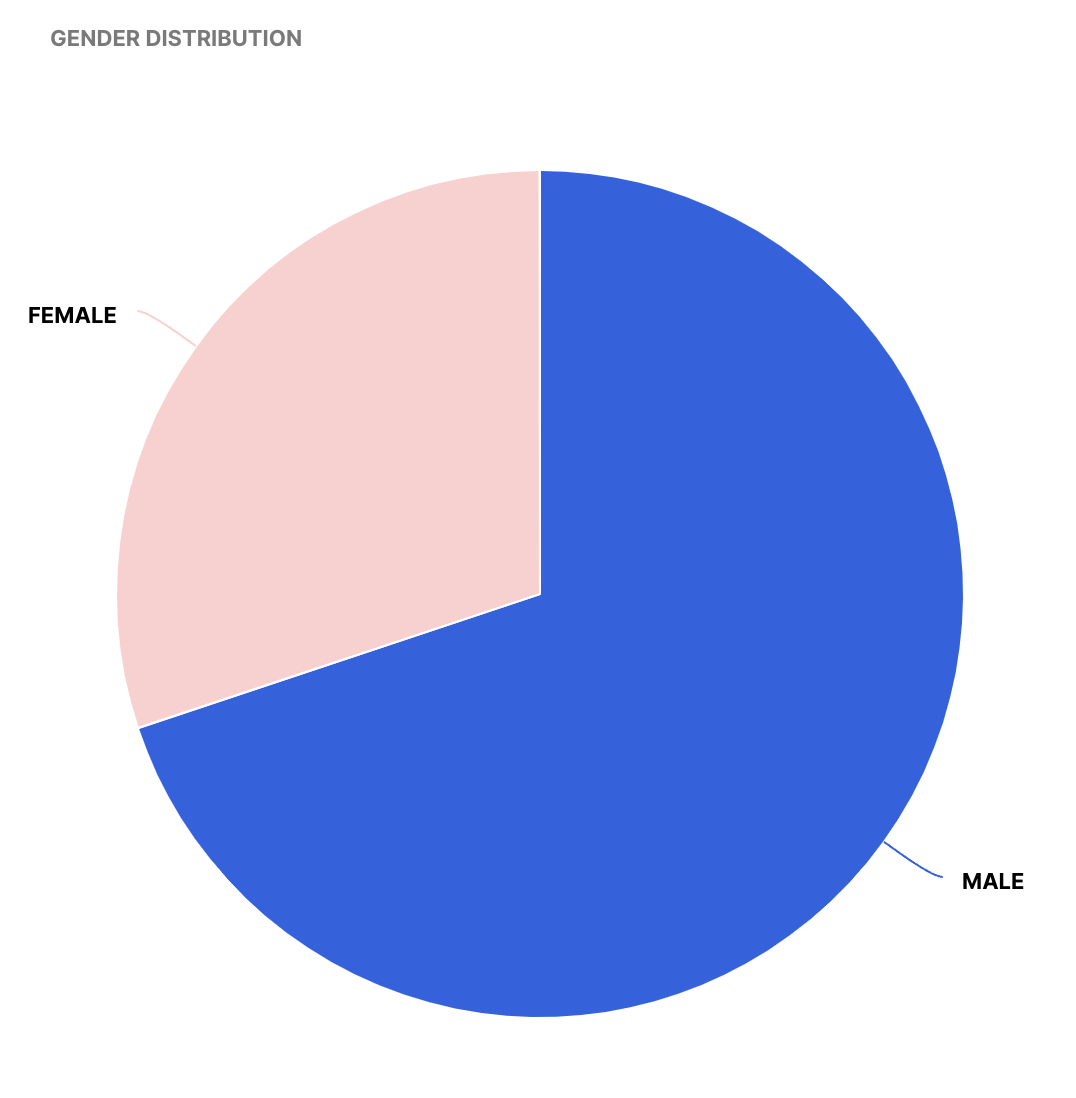
The chart above shows that the male population predominantly mentions Starbucks coffee.
Knowing that approximately 70% of the audience discussing their product is male, Starbucks can now inspect whether this correlates to their usual customer persona and identify opportunities to advertise, personalize, or customize their product and service.
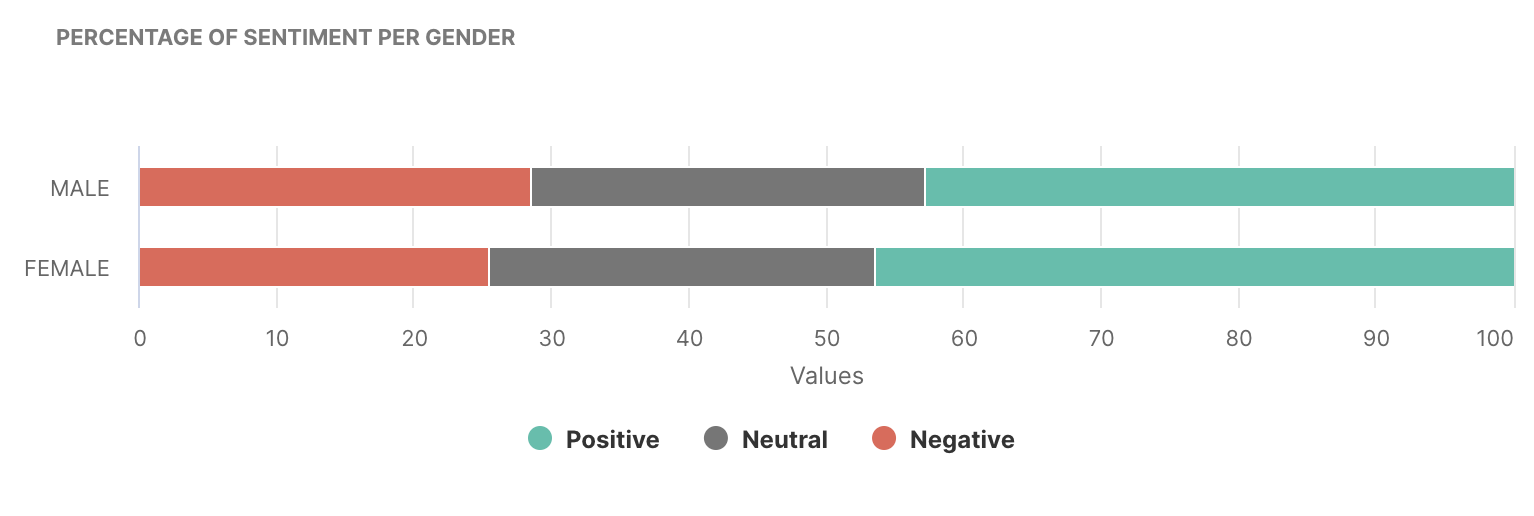
Next, we can analyze sentiment per gender and see that although females discuss Starbucks coffee less than males, they speak more positively than males.
And if we look at the Emoji cloud per gender, we can tell how both sexes feel about Starbucks coffee.

In the center of the male emoji cloud is the coffee emoji, meaning it is used the most in their Tweets. The next one is the crying laughing emoji, while the less represented emojis, such as the skull emoji, eye-rolling emoji, and vomiting emoji, all indicate a negative connotation.
The female emoji cloud is more favorable than the male one, with the primary emoji being the crying laughing emoji, followed by the coffee emoji and crying emoji, and the rolling on the floor laughing emoji and heart emoji next. Generally, it has an affirmative connotation, which aligns with the sentiment analysis per gender.
To wrap up on Demographics
Every business decision relies on data. And the more data you have, the better your chances that this business decision will bring success.
With Demographics, you get an extra dimension in understanding and segmenting your audience, e.g., if the prevailing sentiment towards your brand is positive, you can find out which gender group entices these results and how this changes based on their location.
This can further be used to direct your marketing activities towards this group, or to change them towards the dissatisfied one, ultimately fueling your growth.