“I need to create a custom media report for the client, can I do it?” is a sentence we’ve heard one too many times.
Well, a reason enough to put our thinking caps on and create something that would fulfil this need. And this signified the birth of Custom Reports feature!
In this blog we’ll walk you through various options that Determ’s Custom Reports feature offers and all the ways you can use it to demonstrate the value of your work.
Let’s take a look!
What Makes an Online Media Report Great
Presenting the results of your marketing / PR work to clients or bosses should be easy, but it often isn’t.
How do you explain the value of your work to people who are not in the industry and make sure that they get it?
Clients don’t want to be overwhelmed with a 30-page report, especially if they can’t understand how it contributes to the company’s bottom line, right?
This is why there are a couple of differences between a good media report and a bad one:
- A bad media report: Full of bloated and irrelevant data, data stuffing, no takeaways for the client.
- A good media report: Includes before and after assessment, clearly summarises actions, demonstrates results, offers guidelines to proceed. Preferably in as few data points as possible.
Determ can help you create the latter.
To be clear: every report template in the world, regardless of how well thought-out it is, needs some customization. This does not apply only to PR or social media reports. Data from Google Studio won’t mean anything to the client unless they already know what to look for.
The best reports should be built with that in mind.
Note: We drew a lot of inspiration from Avinash Kaushik and his writings on storytelling with data. While we offer 2020 graph combinations, not all of them will make business sense for your brand to use.
So instead of offering 20 preset graphs, we set out to create a report builder that can be customized to the full extent.
You can even download individual, high-quality .png images to fit them inside your Powerpoint presentation or Word document.
Read 8 Ways Determ Can Help in Creating PR Reports for Your Boss

How to Choose Between 4 Different Report Types in Determ
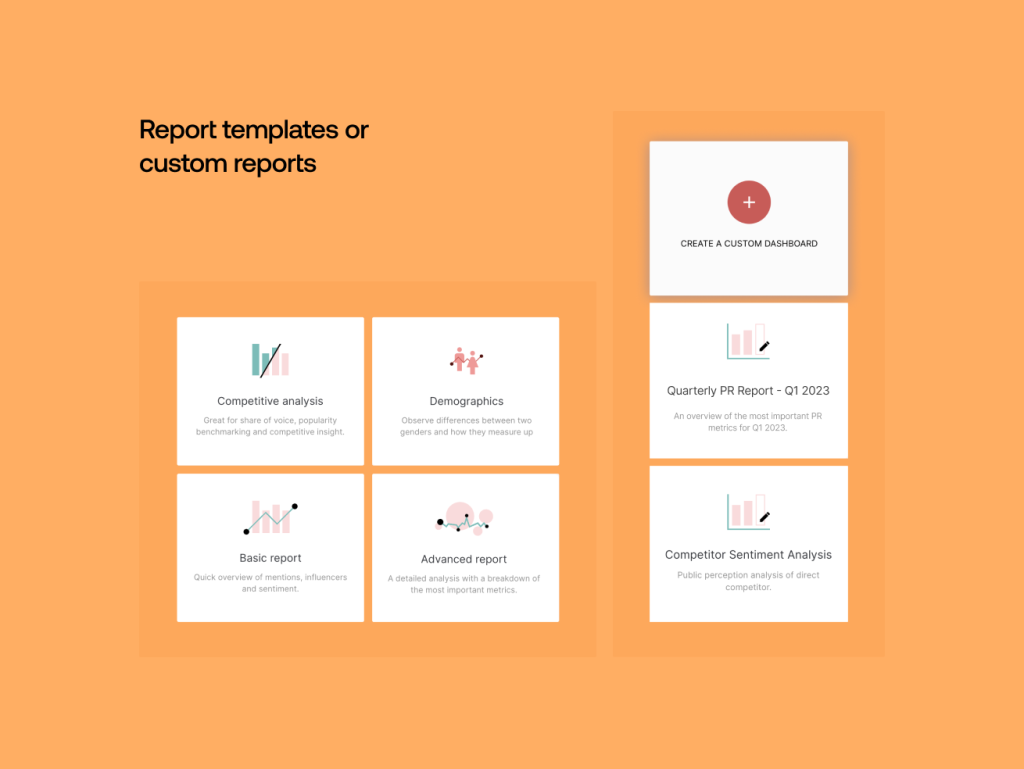
There are 4 different ways to use Determ’s report section.
Here they are, ranked them from simplest to more time-consuming:
- Default Dashboards (Basic, Advanced and Competitive) – These are our three preset dashboards. The graphs contained there are the most requested graphs as chosen by our users. For 90% of the clients, the data in these 3 dashboard types will be enough. If you don’t overburden them with data, you are more likely to move the conversation from “what” to “now what”.
- Customizable Basic, Advanced or Competitive Dashboards – Used when you want to modify the predefined dashboards or rename the graphs. Example: The Advanced report is great, but it doesn’t contain a list of Twitter influencers, and you are eager to show it to the client. It’s easy enough to add it using the reports builder.
- Custom Dashboard Created by Choosing From 30 Predefined Charts – When the preset dashboards are simply not enough, or you prefer a pie chart report type instead of a bar chart for a particular set of data, you should use the custom dashboard creator. Example: when you want a part of your report to be about the client’s campaign, but want the other half to contain data that compares the campaign to competitor activities.
- Custom Dashboards by Building Your Own Charts – The most advanced report building there is. You go deep down into the unchartered territory of combining multiple data points and creating crazy graphs like “influencers by topic (tag) over a period of time, ranked by sentiment from positive to negative”. Meant for advanced media analysts.
Read Branded Reports: Elevate and Automate Your PR Reporting
The rest of the text will deal with a step-by-step guide as to how you can modify your graphs and create the perfect .
How to Choose Between the Basic, Advanced and Competitive Media Report
Determ reports have three dashboards titled Basic, Advanced and Competitive. Here are the differences:
- Basic Report: Gives you a quick overview of the campaign in real time. Great if you need to monitor how the campaign are spreading, view the general sentiment and sources from which your mentions are coming.
- Advanced Report: Provides an overview of the entire campaign, including a breakdown of more advanced data such as sentiment by source, top influencers, locations and languages. Great if you need to show a report of the campaign to the client.
- Competitive Report: As the name says, the competitive report compares two different topics to see how they are performing online. If you have competitors, it is a great way to estimate how far your mentions are reaching. Includes data such as share of voice, sentiment comparison and even influencer comparison.
Read Why Marketing Professionals Need a Media Monitoring Tool
How to Modify a Dashboard Template Using Preset Graphs
Say you like the layout of the default Advanced dashboard, but want to add a couple of data points more before you present your media report to the client.
In order to ease you into the process, we created around 30 preset graph templates (it’s hard to calculate as we are adding new ones per client request. You can request a template to be added as well, just talk to us on chat or contact your account manager 🙂 ).
To access them, simply go to Reports -> Create a custom dashboard -> Advanced Dashboard.
You can hover between any row of data until you see a small plus sign appear, which is how you add a new chart.
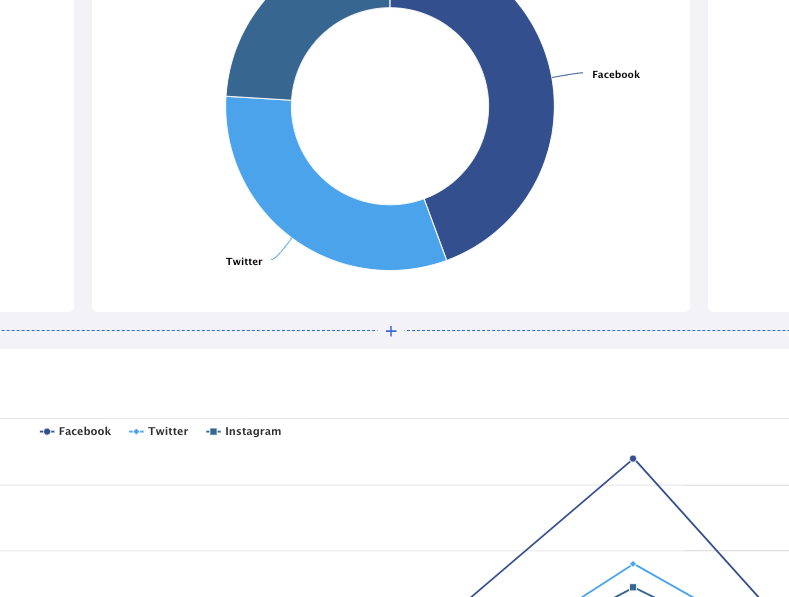
Click on the plus sign and it will take you to the report builder.
Once you chose the graph, simply click Save and it will appear in the dashboard.
One thing to pay attention to is that you can combine charts for one topic with comparison charts in the same dashboard you are creating. For example, I chose the topic Pizza, but I can simply add another topic Hamburger and the data on both will be included. Comes in quite handy when you want to do various competitive reports.
How to Create a Fully Custom Media Report
If the templates and the preset graphs simply are not enough, from now on you can create 2020 custom graph combinations directly from the reports builder. You can present them to clients as proof of your deep media expertise, save them to a dashboard to check every day how your campaign is progressing, or simply dig deeper to find new things about your mentions.
1. Creating a Custom Chart
Click Reports -> Create a custom dashboard.
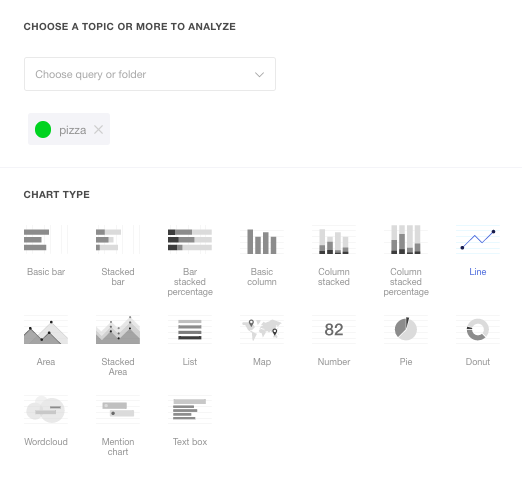
Choose the topic or the folder you want to analyze. Name your dashboard.
I’ve chosen the topic pizza and I want to create a sentiment report about how pizza is perceived online so I named the dashboard Sentiment for pizza.
A blank dashboard will appear. Click Add new chart -> Add empty chart.
You will be prompted to choose between 17 different graph types. It’s important here to know what type of data you want to have.
At the moment, I want to create a list of all sources that wrote about my company, but separate them into three columns with positive – neutral – negative sentiment.
This graph is actually a List, so I choose that option from the menu:
2. Selecting Dimensions for a Custom chart
After selecting the time span, you have to choose something called First Dimension.
First Dimension is the first part of data that you want in your graph. There are a total of 10 dimensions we offer, including analysis by sentiment, location, tag and influencers.
For this particular case, we are going to choose Sentiment (because I want to create a list by sentiment).
You’ll see a Sorting option next.
Sorting by Key lists all the sources alphabetically.
Sorting by Value sorts the influencers according to the numerical value: number of mentions, influence score or anything else.
For the Sub Dimension, I chose Influencers (because I want my sentiment breakdown to show influencers) and Sorting by value.
Here you have the option to trim down the amount of results you want by several parameters. For example, you can choose to trim down results by top 10 influencers, or exclude (reject) Twitter influencers from the list.
3. Selecting a Custom Chart Value
The last thing to which you have to pay attention is the Chart Value option.
Chart value will list all the influencers according to the type of data the mention contains.
The options are as follows:
Count – Number of mentions from the source
Reach – Reach of a mention
Influence score – General influence score of the source on a 1-10 scale
There are also the sum, min, max and average options to combine the data with.
These function similarly to the formula in your Excel or Google Sheets: count + sum will sum all the mentions from a source and rank accordingly. So for example, if an influencer mentioned your company 20 times, they will rank higher on the list.
Average + reach will sort the sources according to the average reach a post from that source has, regardless of how many times they posted.
Min and max options will count only one mention, for example an min + reach will list all the influencers according to the minimal reach they had.
The end result:
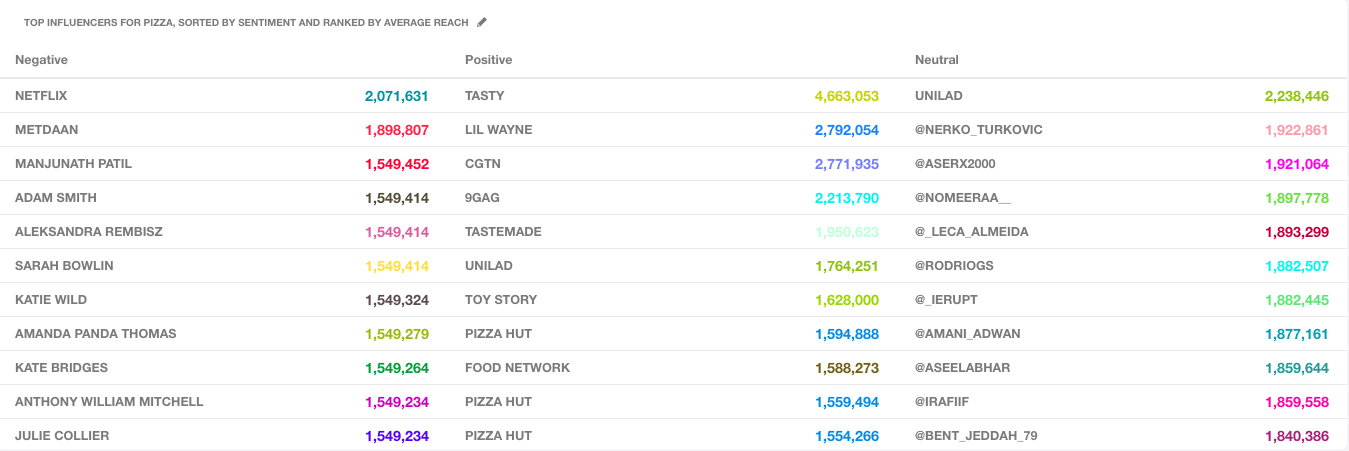
Note: Beginners in data analysis can find it a bit tricky to set up parameters – so please request help via chat if you feel you are not getting the results you wanted.
There you have it, your first custom graph!
Finally
As we’ve already mentioned, we are waiting for your feedback to make the reports even better and more intuitive for beginners. So please – whether it’s praise or a critique – contact us with your ideas.
Want to try our reports, but you are not a Determ user?
Book a demo and let our experts show you the best way to present your data!


